Your carbon footprint, in real time and online: from yearly guesswork to daily action
Most organisations measure emissions once a year from old invoices. Live carbon tracking turns sustainability from a report into a daily habit that also cuts costs.
 Insight
Investors, regulators and customers increasingly ask one question: what is your carbon footprint? For many organisations, the honest answer is a rough estimate pieced together from fuel receipts and grid bills months after the fact.
That approach is slow and it is often wrong. Worse, it gives teams nothing to act on during the year. Real-time carbon monitoring changes that.
How live carbon tracking works
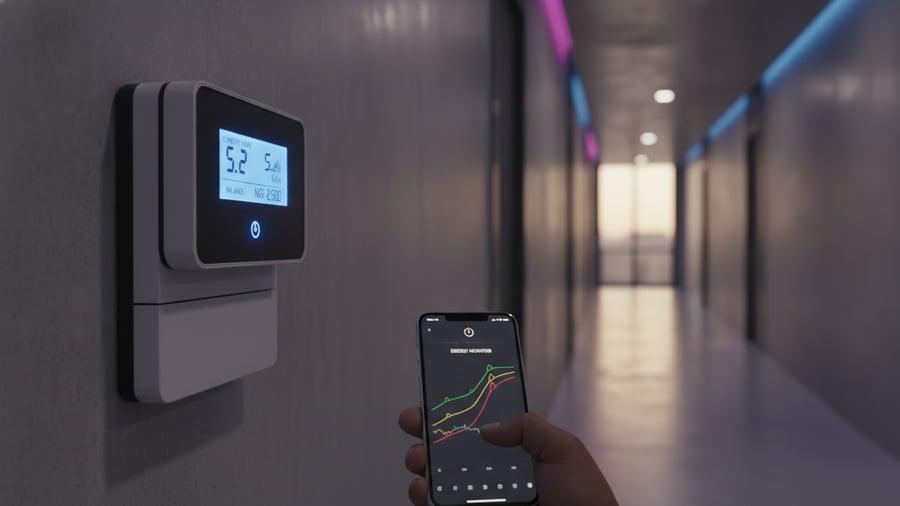
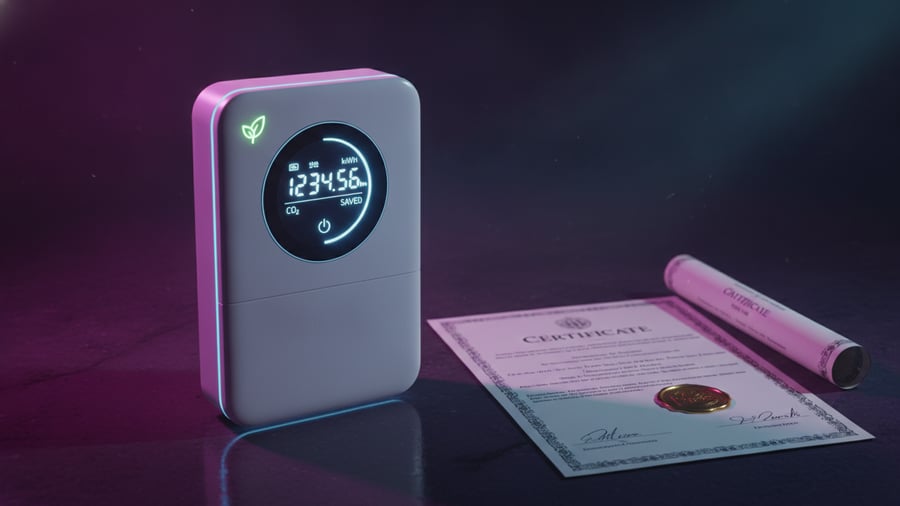
The eChecker system measures energy at the source and knows whether it came from the grid, a diesel generator or solar panels. Each source has a different emissions factor, so the system converts every kilowatt-hour into carbon as it is used and shows the result online.
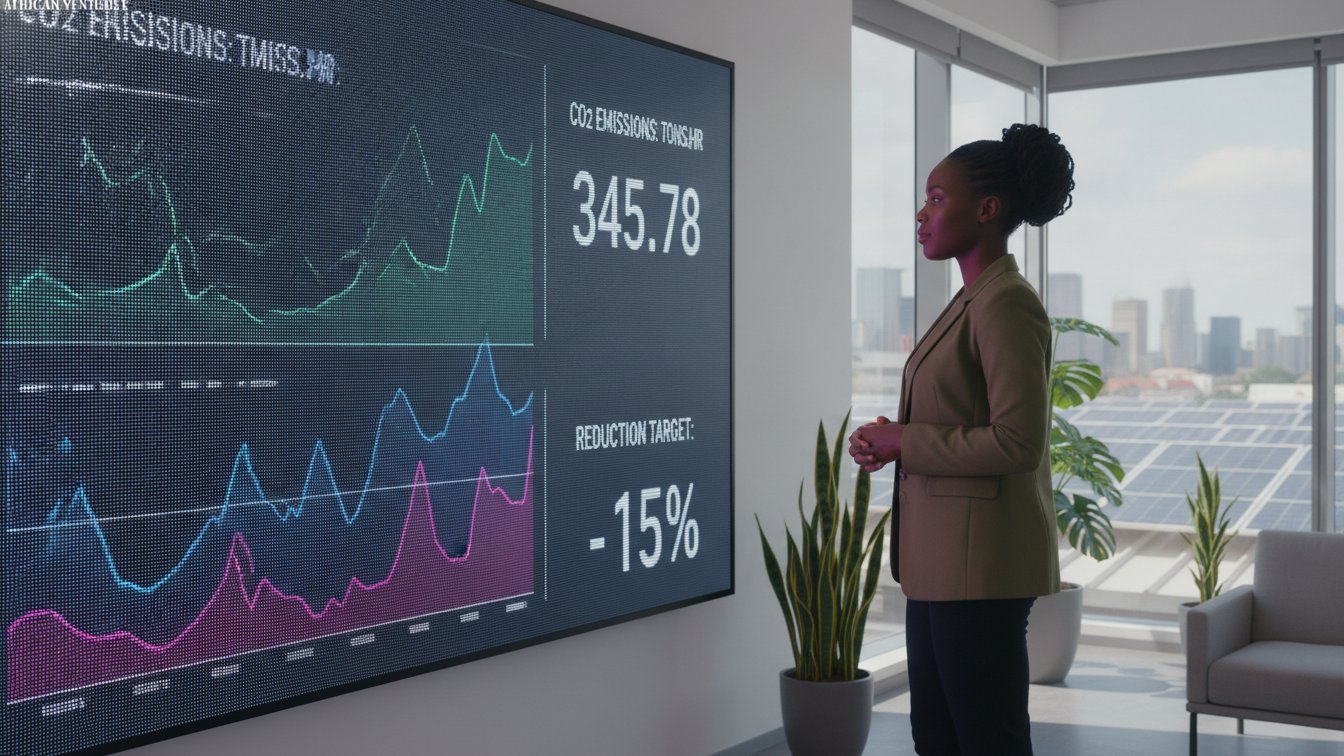
- A live carbon figure for each building, site or department
- Clear breakdown of emissions by power source
- Daily, weekly and monthly trends you can share with leadership
- Exportable data for ESG and sustainability reports
Why real-time beats once-a-year
When teams see emissions rise the moment a generator kicks in, behaviour changes. Generators get switched off sooner, solar is used more, and waste is spotted while it is still happening. Lower emissions almost always mean lower fuel bills as well.
Getting started
You do not need a sustainability department to begin. Start with your biggest site, set a simple baseline for one month, then agree on one or two changes, such as shorter generator hours or shifting heavy loads to sunny hours. The dashboard will show the impact within days.
"Carbon data used to be something we reported. Now it is something we manage."
How organisations scaled and stayed productive
A multi-site manufacturing group in Ogun State
The challenge
Three factories relied heavily on diesel generators. The group needed credible emissions figures for an international buyer and had no reliable way to produce them.
What we did
eChecker energy and carbon monitoring was installed at each plant, with live dashboards for plant managers and a combined view for the head office.
18%
Lower emissions within nine months
41 hrs
Less generator runtime per month, per site
2 days
To prepare the ESG report, down from six weeks
"Our buyer asked for proof, and for the first time we could show live numbers instead of estimates."
Customer names are withheld at their request. Results reflect each organisation's own reporting.

Explore eChecker Smart Meter
Prepaid smart metering for estates, malls and offices.